What do you do when you're assigned a repetitive task at work? Me? I start trying to find ways to do it faster. Eventually, repetitive work becomes boring, so the act of finding efficiencies keeps my mind present. But what do you do when the repetitive work is nigh on impossible to do faster? When the work itself is running a Splunk dashboard, and then manually capturing the screenshots.
My first idea was to just screenshot the entire page and be done with it. Outlook didn't like that since the screenshots were thousands of pixels in height.
But then, I wondered if I could multitask a bit. Making the work not only disappear faster, but also challenge myself, AND maybe even teach myself a new skill or two.....

The project started with me considering using Java to code it. And then I remembered I hadn't done that since college, and coding it in Python would be faster..... And thus, the project began for real.
The first idea was that I'd get the exact pixel coordinates of each dashboard, and then crop the images accordingly. Spoiler Alert: I figured it out, but it was not really useful as you'll see below.
With the help of Gimp, Google, and a Chrome Plugin, I had the foundation laid. I started with a script that would combine multiple images together vertically. The screenshot generator wasn't able to create just one massive screenshot of the biggest dashboards. So this was a critical step. After that, the next obvious step was making another single task script that could crop parts of the image. After that began the loops. Specifically one that would run the cropper until it ran out of things to crop.
After that was done, I needed to gather the full sized screenshots of every dashboard I wanted the script to work on. And then, I needed to open them in Gimp, and figure out the pixel locations. I thought "It'll be ok, you'll be glad you did this later" Being me though, the efficiency kick hit, and I found a way to only need to get a single location for most of the panels. Because I could safely assume that the left and right X coordinates would be constant. And that the top Y coordinate would be the bottom Y coordinate from the preceding panel.
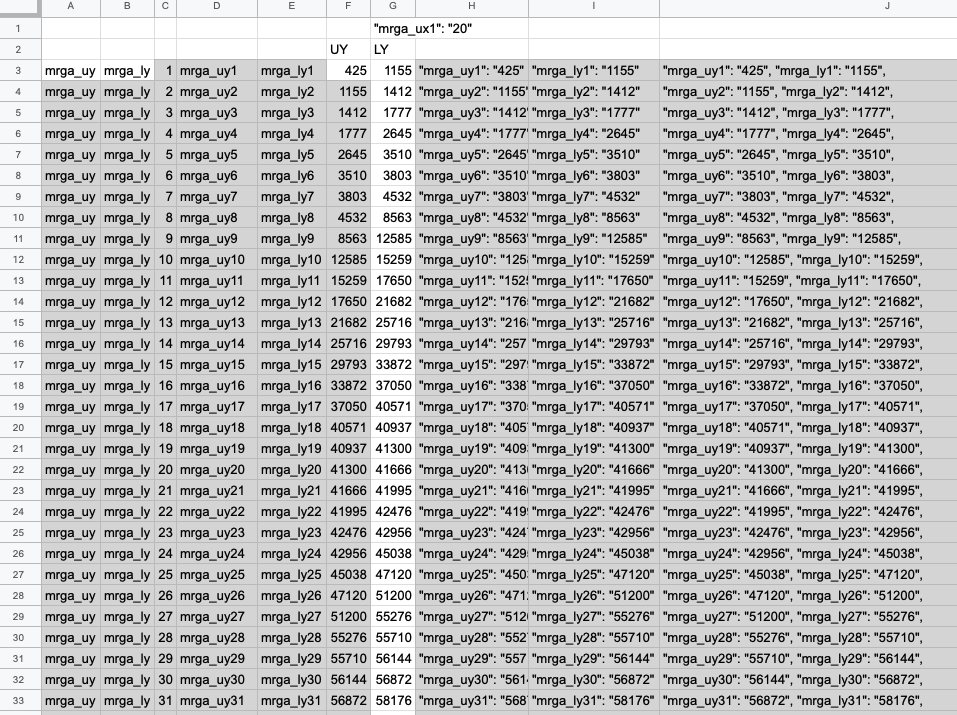
From there, I was me again, and put all of that into a spreadsheet so it would write the code for me. And so, my first Python dictionary was complete. Like everything else so far, I had no idea how to even create one before this little side project started.
Now though, you've probably figured out a key issue with my plan. What happens if the dashboards change their size? Well, the answer is that I slightly considered that. I built in a way to compensate for one of the panels I knew would change. Little did I know that the entire size of the dashboard would change depending on the data being run. And thus, the first iteration of my plan was a half win.
With that realization.... realized.... it became obvious that I'd need to substantially up the sophistication of the method for getting the coordinates for the cropping. Using the image combiner script to make the full sized image and getting the coordinates per type of report was not sustainable. It would just be shifting the monotony to a new part of the process. But surely I wouldn't be able to figure that out with my basic Python knowledge.
Spoiler alert Pt. 2: I proved myself wrong.
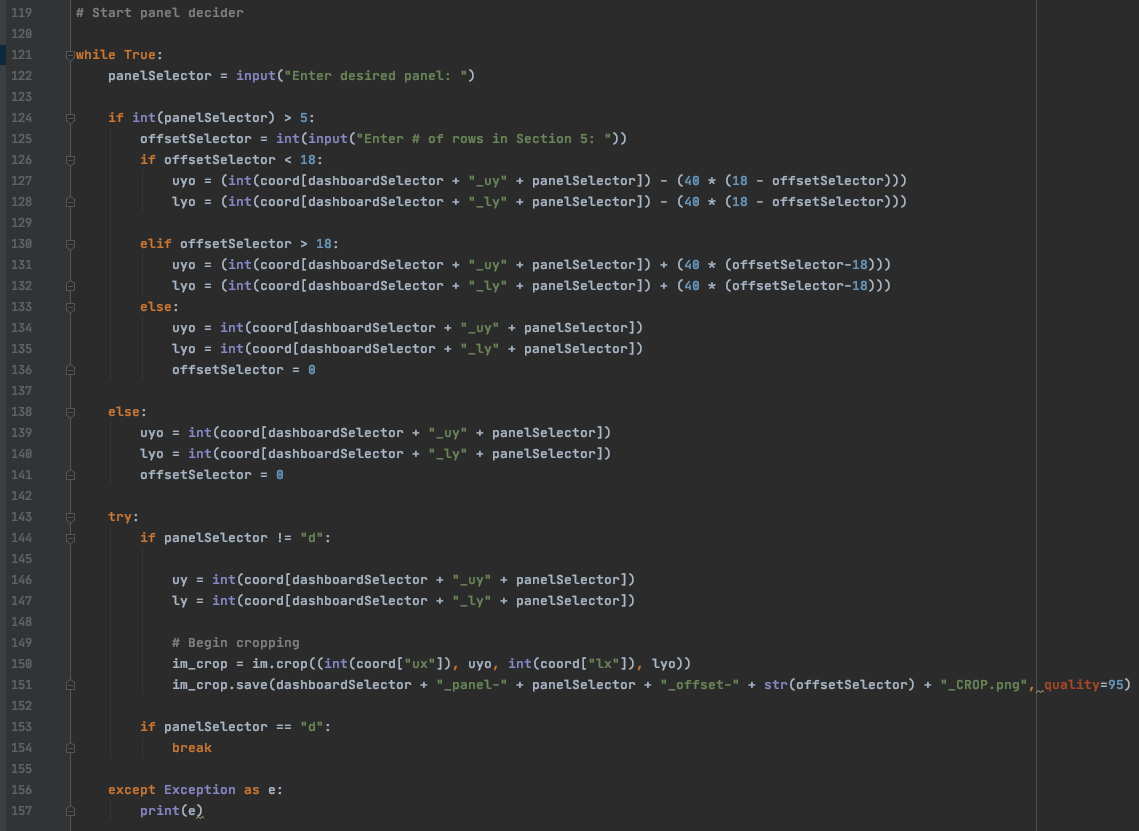
Within python, there's a way to read the colors of a given pixel, and get the values. And the Splunk dashboards I would be doing this with, all had the same basic colors. With that knowledge in hand, I did what I did before. Broke down the process into as many smaller modules as I could. The whole scope of my plan was beyond what I could do at first. But I could still do individual parts and glue them together at the end.
The biggest difference was that with this phase, the goal was to decrease the number of things I as a user needed to manually tweak or specify to make the script run.

So, in the final tally, were the dozen or more Python scripts I made to get this fully working version worth it? Well, it took a few weeks. And in those weeks, I was actually being mentally stimulated and challenged myself to do what I thought was impossible for someone at my skill level to do.
So yeah, it was 100% worth it. From a purely work time saved perspective, I essentially wiped out manual work for any of the dashboards. No more snipping tool. And I did it without being prompted.
If there's one thing I hope this site conveys about me, it's that I have a genuine need to learn and grow to be happy at work. I wasn't happy, so I found a way to make myself happy. And by that measure, it was the most successful and fulfilling thing I've done at my current position so far.
It is a full win. And it made the impossible, possible.